By Nicole Storeshaw, Director, Government Relations, CHBA
CHBA has just released its 2024 Municipal Benchmarking Study. This is the third edition of the report which compares 23 Canadian municipalities, examining how their processes, approvals timelines and government charges and fees contribute to housing affordability and supply issues in major housing markets across Canada.
The study, commissioned by CHBA and conducted by Altus Group, assesses municipalities’ performances on approval timelines, municipal fees and planning features influencing housing outcomes, including affordability and availability of housing for young families, and the total cost implications of these municipal processes and policies. The latest edition also includes two new additional areas of scoring: Indirect costs of the residential development application process and a housing outcome measure.
Development charges, delays and inefficient processes at the municipal level directly impact the price of homes and how many are built. The purpose of this study is to facilitate dialogue with all levels of government, but particularly with municipal governments, on the effects of longer timelines, higher fees and the level of efficiency of processes on housing affordability and outcomes. This report also offers insight into best practices that municipalities can adopt to help improve their housing affordability and supply. It also points to ways that the provincial and federal governments can continue to drive and support change at the municipal level.
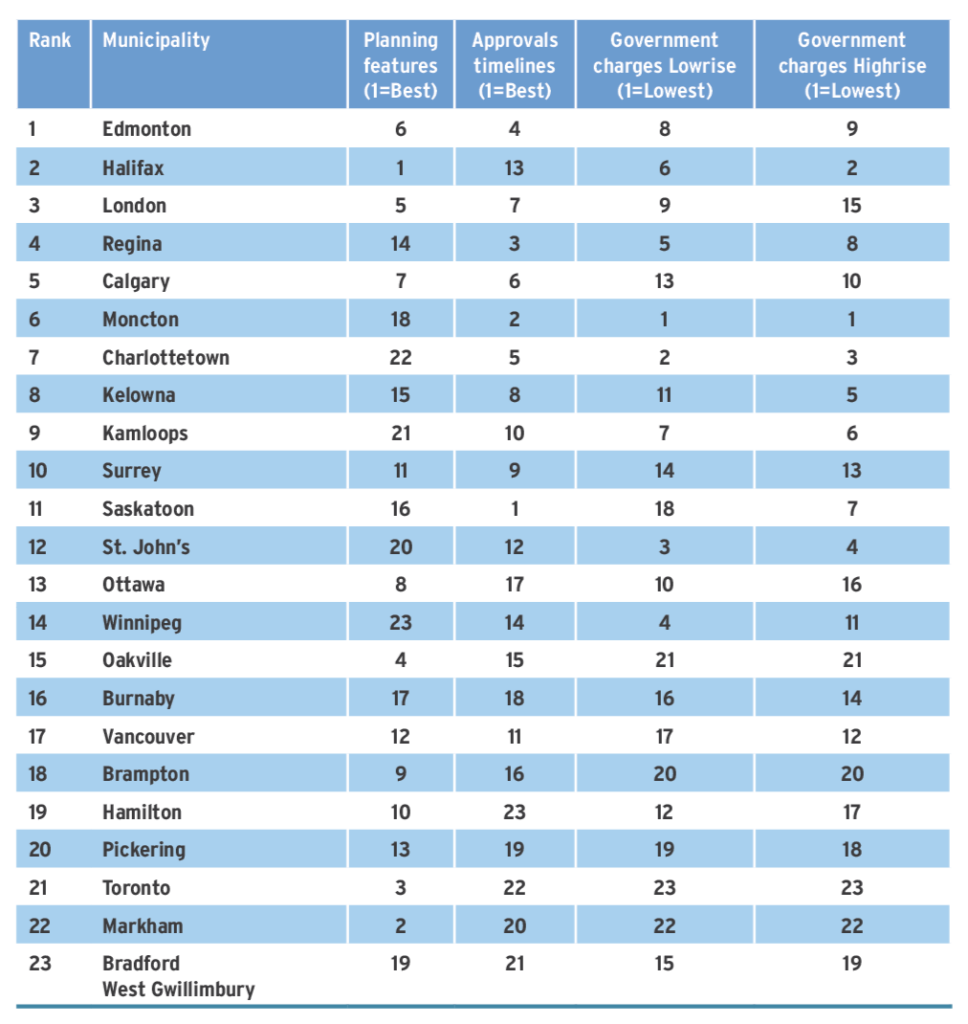
Edmonton ranked number one in the study and the City of London was the only Ontario municipality in the study to be in the top 10. The lowest ranking municipalities were all in the Greater Toronto Area.
The full report, plus fact sheets for each municipality, can be found at chba.ca/municipal-benchmarking
Municipal fees keep going up
Municipal fees charged on new residential developments went up by an average of $27,500 for a unit in a lowrise development, and $3,000 for a unit in a highrise development since the 2022 study, raising the new average in Canada for municipal fees in these cities to $82,600 (ranges from $8,700 to $195,000) at the time of the 2024 study.
Municipal fees charged on new residential developments increased by an average of $3,000 for a highrise home since the 2022 study, raising the new average in Canada at the time of the 2024 study to $35,000 (ranges from roughly $1,600 to $134,400).
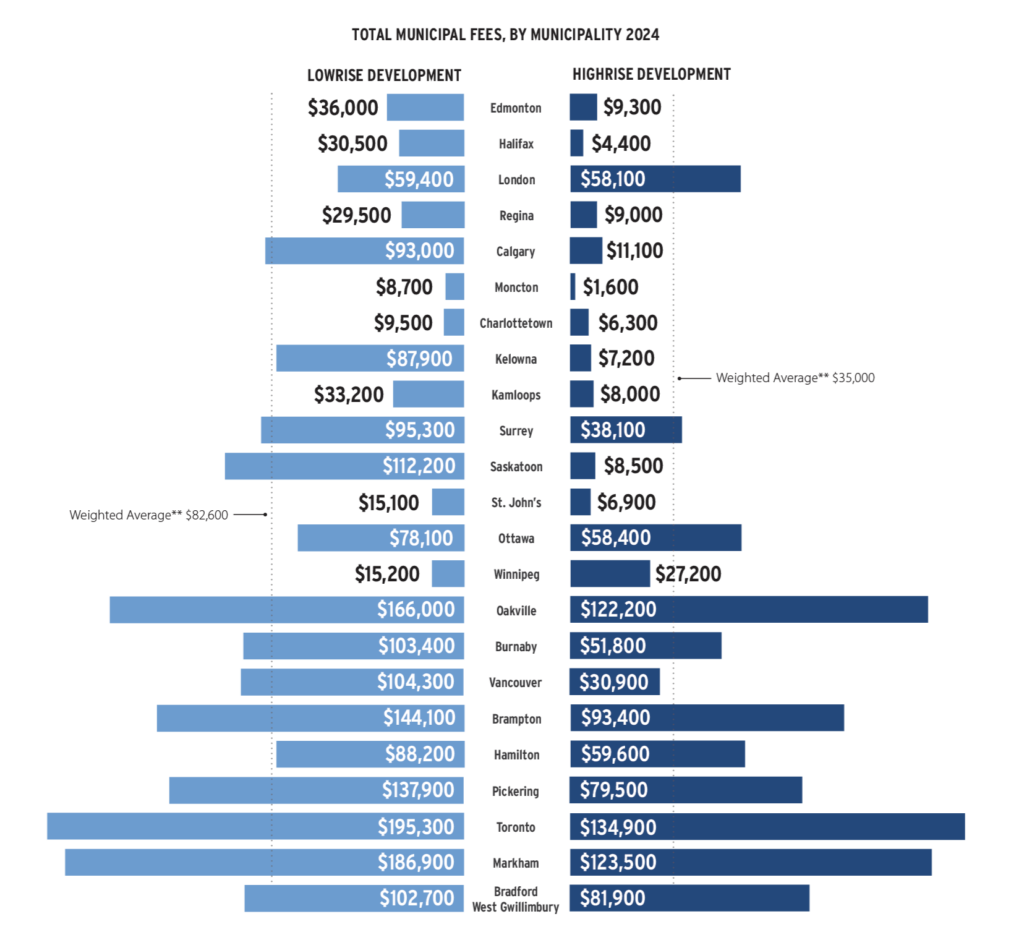
**Based on municipal share in overall residential development in 2024. Source: Altus Group Economic Consulting, based on Municipal Fee By-Laws as of October 2024
Approval timelines improving slightly, but still high
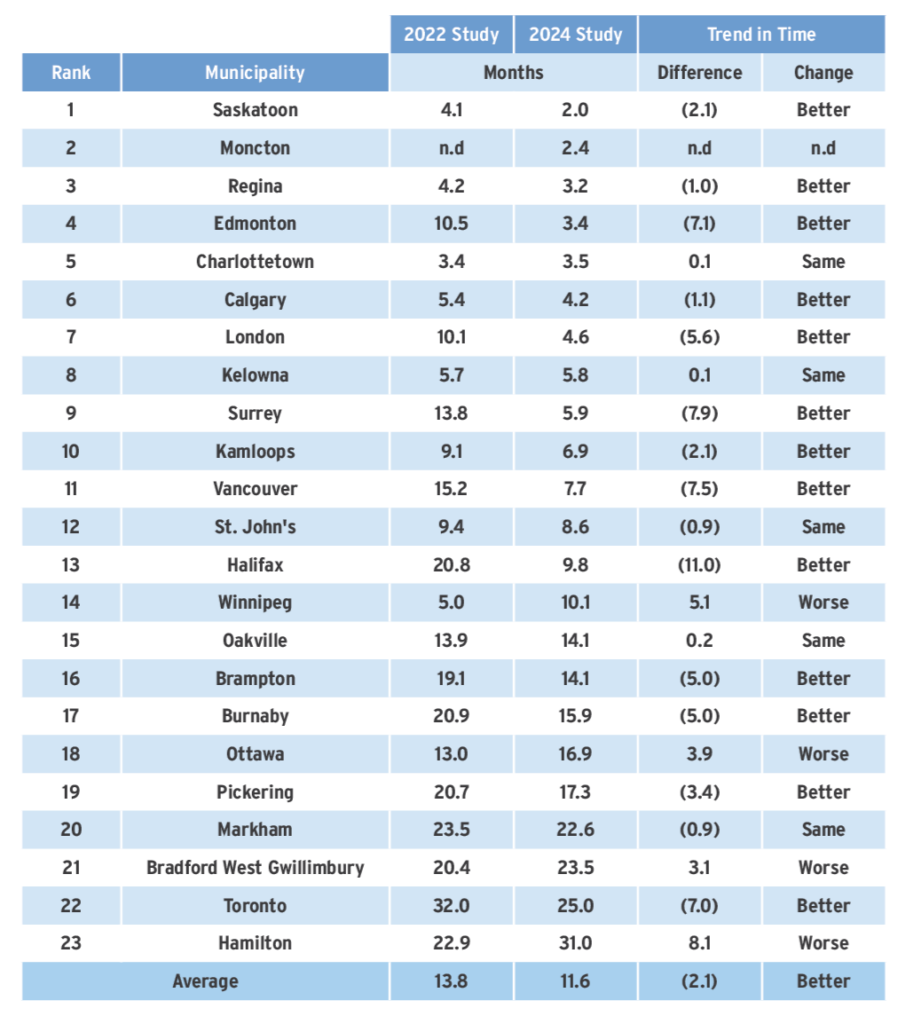
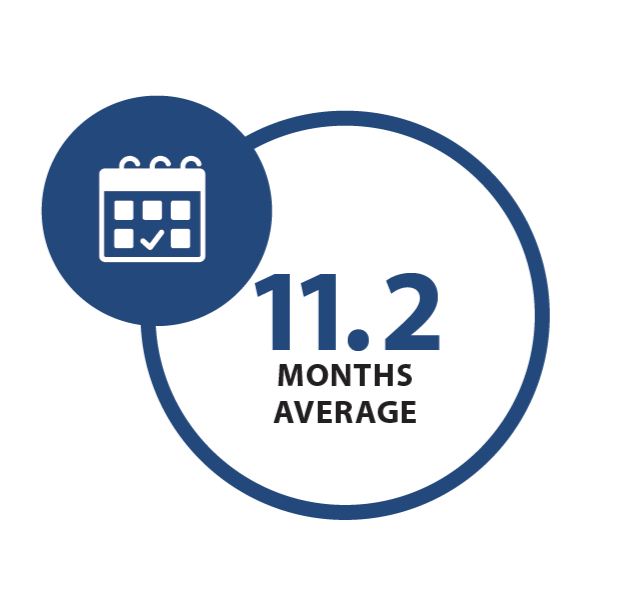
Delays in approvals impact housing affordability and months of delays can add tens of thousands of dollars to the cost of a home. In the 2024 study, approval timelines improved marginally from the previous study, but remain high. It took an average application 11.2 months to complete in the 2022-24 study period, down 2.1 months from the time of the last study.
The average timeline ranged from two months in Saskatoon to 31 months in Hamilton. Thirteen municipalities have better timelines than reported in the 2022 study, five have the same and four are worse.
Indirect costs due to delays
There are indirect costs that accumulate on a development as its application goes through the application process, including: property taxes, financing costs, and cost escalation of construction materials and labour due to inflation.
Indirect costs can add between $2,178 (Moncton) and $10,750 (City of Toronto) per month, per unit, to the cost of producing housing in a lowrise development. For highrise developments, Moncton is again the lowest at $1,174, and Vancouver the highest at $6,855 per month, per unit.
Impact on housing outcomes
In general, municipalities that score low on the municipal benchmarking index have worse housing outcomes. Higher Municipal Benchmark Index scores are positively related to a blended measure of improved housing affordability, lower suppressed household formation rates, a balanced vacancy rate and net positive municipal migration. Poor Benchmark scores create a high likelihood that a municipality experiences relatively poor housing outcomes – the opposite of the four blended measures. Outlier cities like Halifax and London illustrate how housing policy changes for new supply need time before measurable housing outcomes improve.
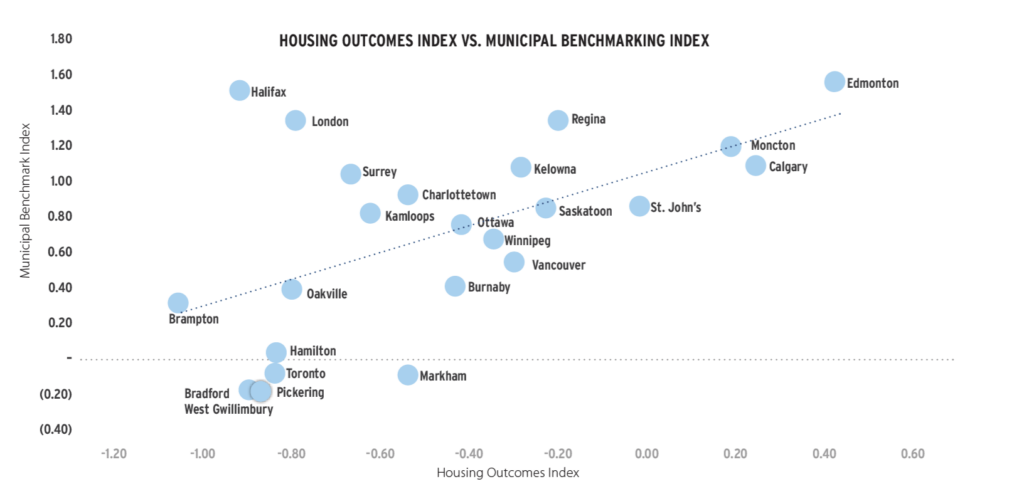
Source: Altus Group Consulting, based on Statistics Canada, CMHC and Municipal Own and Sourced Data
Housing construction not keeping up with population
All municipalities studied experienced explosive population growth between 2021 and 2023, along with immigration. However, growth was limited in some of the larger municipalities studied. Toronto, and Vancouver had a significant outflow of residents through out-migration, as housing affordability deteriorated considerably in these areas.
The number of new units for which construction started for every new person added to the population in the 2012 to 2021 period was the lowest it’s been since the data began in 1972. Even accounting for a reduction in population growth in 2025 and 2026, that gap is widening in the 2022 to 2027 period, barring an increase in housing starts. Canada is building fewer homes to accommodate population growth than it has than ever before.
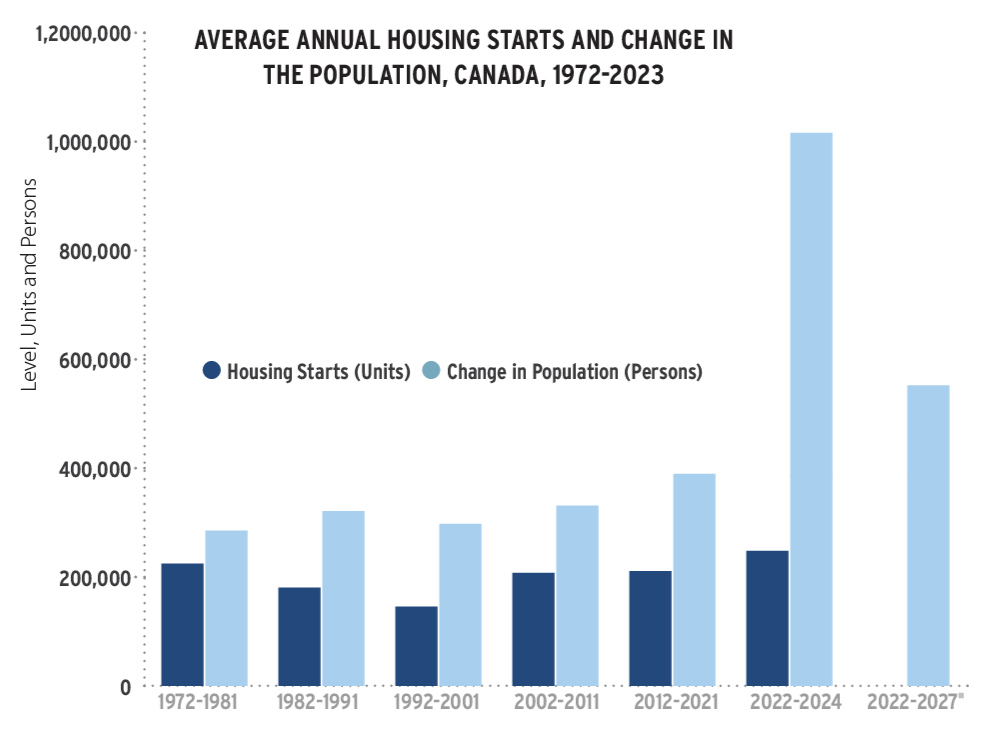
*Reflects updated immigration targets and forecasts of population growth for the 2025-2027 years. Source: Altus Group Economic Consulting, based on Statistics Canada


