


By Brett Cass, Technical Manager, Net Zero Energy Housing, CHBA
The CHBA Net Zero Home Labelling Program is delivered through a national network of CHBA Qualified Net Zero service organizations, trainers, energy advisors, builders and renovators that design, model, build/renovate, test and inspect each home. The program has become an important stepping-stone in Canada’s pursuit to a more sustainable future.
Each year, CHBA publishes a Program Summary Report which takes a deeper look at the performance of these homes. The report supports CHBA members’ voluntary adoption of Net Zero housing by strengthening members’ knowledge and awareness through the sharing of information.
Program growth
Since the pilot in 2015-16, the program has labelled more than 1,400 homes. In 2022, 425 homes were labelled, which is a 75.6-per-cent increase over 2021. Interestingly, in the last three years, there’s a trend showing more homes labelled as Net Zero Ready in comparison to homes labelled as Net Zero.
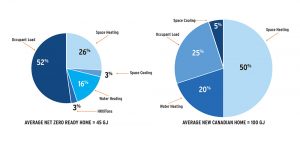
Energy breakdown of an average Net Zero Ready Home vs an average home built to meet code
Annual energy consumption is defined as the amount of energy required to operate the home on an annual basis. This includes energy required for space heating, space cooling, water heating, ventilation and occupant loads (which is the lighting, appliances and plug loads). On average, a Net Zero Ready Homes uses less than half the energy of a code-built home.
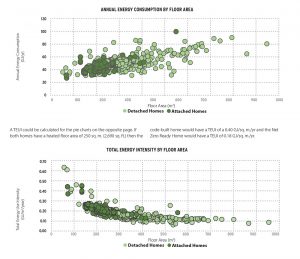
The chart below compares the annual energy consumption of Net Zero and Net Zero Ready Homes to their heated floor area. Each dot represents one of the 1,117 homes labelled to the end of 2022. There’s a strong correlation between the size of the home and the amount of energy consumed annually.
In order to compare homes of different sizes, a normalized metric called Total Energy Use Intensity (TEUI) can be used. To calculate the TEUI, you take the total annual energy consumption and divide by the heated floor. A lower value indicates better performance. The chart below shows the same 1,117 homes but plotted based on their TEUI. The chart shows that, in general, smaller homes often have a higher TEUI than larger homes. This is because not all energy consuming loads scale as the buildings floor area decreases in size. The energy consumption required for space heating and cooling does scale as the floor area of a building decreases, although the energy consumption of loads such as water heating, and appliance energy does not scale. Therefore, a smaller heated floor area can impact the ability of a home to achieve a lower TEUI than a large home, even though the smaller home may consume far less energy overall.
There are several home performance metrics, such as total energy use intensity (TEUI) that help us to better understand and compare the energy performance of homes. The 2022 Net Zero Program Summary Report looks at a variety of performance metrics, including total annual energy consumption, whole home heat loss, total energy use intensity, operational carbon emissions intensity and more. CHBA members can download the annual summary reports for free (non-members can purchase them) at chba.ca/nzhlpsummaryreports.


